Spatial & Systems Analytics
Integrating emissions, exposure, and cross-sector systems to guide climate and air quality decisions.
Air pollution and climate risk are not isolated phenomena — they emerge from interacting systems: transport, land use, industry, household energy, inequality, governance.
What We Analyze:

Multi-Scale Spatial Modeling
We analyze emissions and exposure across geographic scales—from neighborhoods to regions—to reveal spatial gradients and emerging hotspots.
- District and sub-district emission mapping
- Population-weighted exposure modeling
- Urban–rural and peri-urban transition analysis
- Temporal variation across seasons and economic cycles

Cross-Sector Systems Integration
Pollution and climate risk emerge from interacting systems. We integrate transport, industry, energy, land use, and household dynamics into unified analytical frameworks.
- Transport–land use interaction modeling
- Industry–energy supply coupling
- Infrastructure and urban growth feedbacks
- Scenario testing across sectors

Risk, Exposure, & Equity Analytics
We connect emissions data to human exposure, vulnerability, and health outcomes to identify leverage points for equitable intervention.
- Hotspot and vulnerability mapping
- Climate–air pollution co-benefit analysis
- Demographic and income-based exposure disparities
- Policy and intervention impact evaluation
From Maps to System Intelligence:
Translating spatial analytics into climate, air quality, and equity strategy.
We connect spatial inventories to dispersion models, health impact assessment frameworks, and systems simulations to evaluate how interventions reshape exposure patterns and climate forcing.
By modeling cross-sector feedbacks and unintended consequences, we help policymakers and institutions prioritize strategies that deliver durable, equitable, and scalable impact.
What This Enables:
- Population-weighted exposure forecasting
- Intervention scenario modeling across sectors
- Carbon–air pollution co-benefit quantification
- Infrastructure and transition pathway evaluation
- District-level prioritization for targeted action
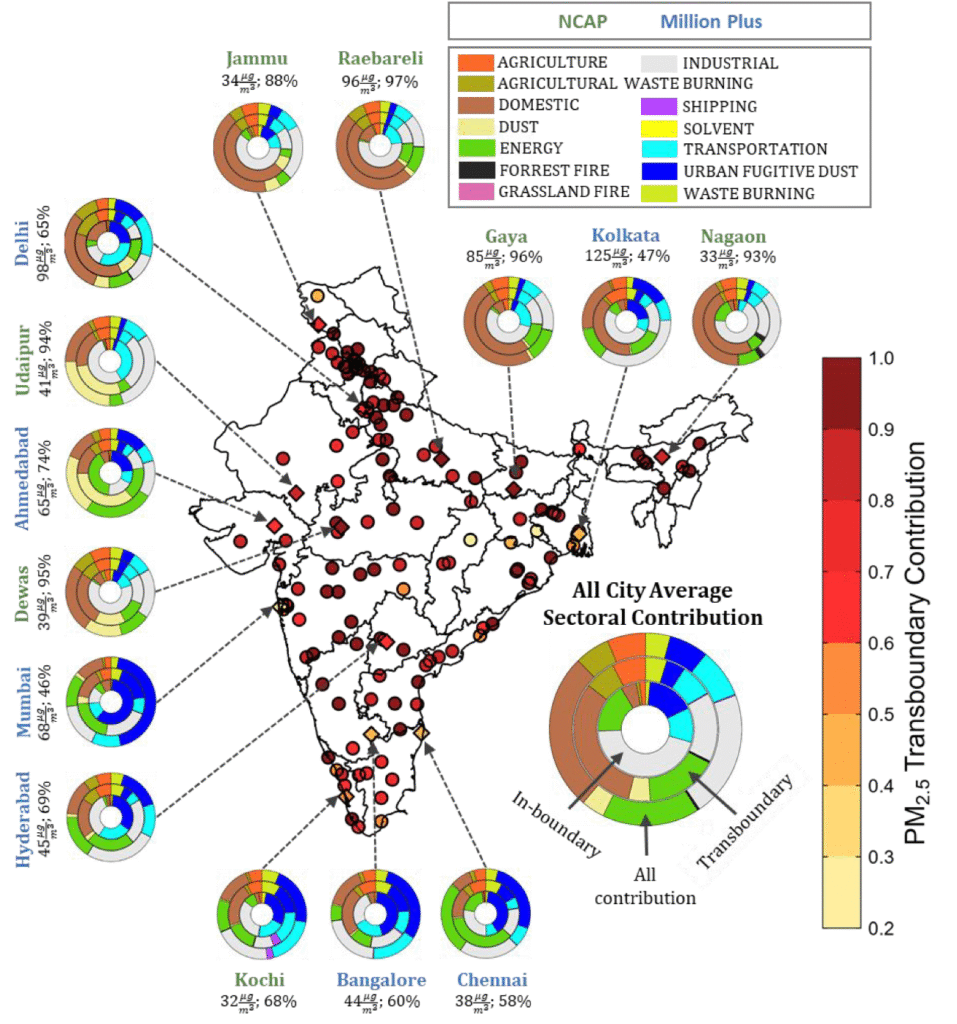
Case Example: Transboundary PM2.5 in Indian cities
Why city-only action plans can’t deliver city air-quality targets.
The Question:
How much of a city’s PM₂.₅ is driven by emissions outside the city boundary—and what does that mean for city-level clean air plans?
The System Approach:
We combined high-resolution emissions (5 km × 5 km) with two independent modeling frameworks (top-down STILT-PM₂.₅ and bottom-up WRF-Chem) to quantify within-boundary vs transboundary contributions across 143 Indian cities.
Key Result:
Across cities, ~85% of urban PM₂.₅ originates from transboundary emissions, with domestic biomass burning, energy generation, and industry among the largest contributors to the transboundary share.
Decision Implication:
For most NCAP cities, within-city controls alone are unlikely to achieve even conservative targets—pointing to the need for regional, multi-scale action planning and coordinated implementation.
Read the peer-reviewed article (open access):
Transboundary emission contribution to PM2.5 concentrations in Indian cities
🌍 Spatial systems analysis reveals leverage points—where targeted intervention can reduce pollution, lower climate risk, and improve equity simultaneously.